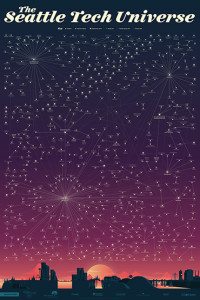
Today we are proud to introduce the Seattle Technology Universe map. This map, the result of hundreds of hours of research, discussion, and associated work, has been a true community effort spearheaded by Madrona and the WTIA. Along with sponsors the University of Washington, Cooley, Davis Wright Tremaine, Perkins Coie, and Wilson Sonsini Goodrich & Rosati, many people who have been deeply involved with startups in the region for years added their time to help sift through the data and offer commentary, suggestions, and a lot of reminiscing.
What started as a gathering of key industry figures from government, education, industry and associated professional companies in April of this year, has become an impressive visual statement of where the startup ecosystem in Washington State has evolved to at the close of 2015. The map includes over 600 technology companies in Washington State and shows links to the companies (such as Microsoft and Amazon) and institutions (such as the University of Washington) that are the sources of the people who founded these companies. There is more on what is and what is not on the map below.
The map surfaced many interesting insights, some predictable but some unexpected. The largest anchor companies, Microsoft and Amazon, and the research powerhouse of the University of Washington, continue to be the most powerful forces spawning new companies in our region. The solar systems of Expedia and RealNetworks alumni founders continue to grow. After being acquired by Microsoft, aQuantive alumni have gone on to create a significant collection of new companies. Newer multibillion dollar companies have grown rapidly (like Zulily) or over time (like F5) and have created their own ecosystems. Other billion dollar companies like Tableau have seen mega-growth, but have not yet begun to spin off new entrepreneurs and companies. While McCaw Cellular and Boeing impact on the overall ecosystem has gone down as a percentage of overall activity, their legacy continues to be significant. Combined with the 69 engineering centers, this ecosystem map shows why Seattle has more than 90,000 software developers, which is more than any other metro area. (developer data from WTIA ICT study)
Spurring this growth is amazing innovation. Amazon is the fastest growing enterprise technology business in the world. Ever. Just 10 years ago Amazon Web Services was born, and they are now a $10 billion per year business. Microsoft just celebrated its 40th year and continues to bring cutting edge products like the Surface and Hololens to the market.
Seattle is a hub for all the big trends that are driving technological growth – cloud, ecommerce, big data, mobile applications, gaming, and virtual reality. In the past eight years more than $450 billion of wealth has been created as measured by M&A and market caps. During that time more than $58.4 billion has been invested in companies in our region.
Take a look for yourself and see what you think (and note the how we got here below). We are sure there are companies that were missed, or companies included that some feel perhaps should not have been. Let the conversations begin.
(click on the poster and then click to zoom in!)
How we got here
While the project started with lists found in the original dataset, on blogs, from services including Pitchbook, the real work was in the hours of research that qualified companies for the map, and related them via their founders to other companies in the ecosystem. A team of interns from Madrona and WTIA supported the industry knowledge that these two organizations, and significant contributions from our sponsors the University of Washington, Cooley, Davis Wright Tremaine, Perkins Coie, Wilson Sonsini Goodrich & Rosati helped us get to the final dataset. Killer Infographics took the data and put a huge amount of heart and soul into making the data come alive. In fact, when we first met Amy at Killer Infographics to discuss this project in 2014, she already had the fire to get this one done and make it work! And hours into fixing errors that were only obvious in the graphical representation, it is final. Or semi-final.
While we fixed tens of mistakes, there are mistakes in this graphic. We intend to make this a living data set and will be updating more often than every 7 or 8 years. Further, we intend to build an interactive version of this with more levels of data that will paint a more descriptive and nuanced picture of our startup ecosystem. Tableau has very generously signed up to help with this second stage of the project and we are excited to begin that work in 2016, along with other sponsors. Given the months of work it took us to get to this place we are targeting an end of 2017 release of that data.
If you have suggestions please feel free to get in touch with us at [email protected]; [email protected] and use #SeaTechUniverse on twitter
Criteria for being on the map (mostly science but some art)
- Company is in Washington state and is in the information technology and communications industry as its main business
- If the company is not in existence, it was an important step in other extant companies or was an important M&A for the region
- If the company’s main business is NOT information technology and communications, they have spawned companies clearly in that arena
- Company is capitalized as measured by the regular VC rounds or has raised outside seed funding recently or is clearly thriving as measured by employees, products, etc
- Large national or international companies who have opened engineering offices here


